Where Would be the Best Place on the Lake to Place a Treatment System for Nitrate?
October 2019
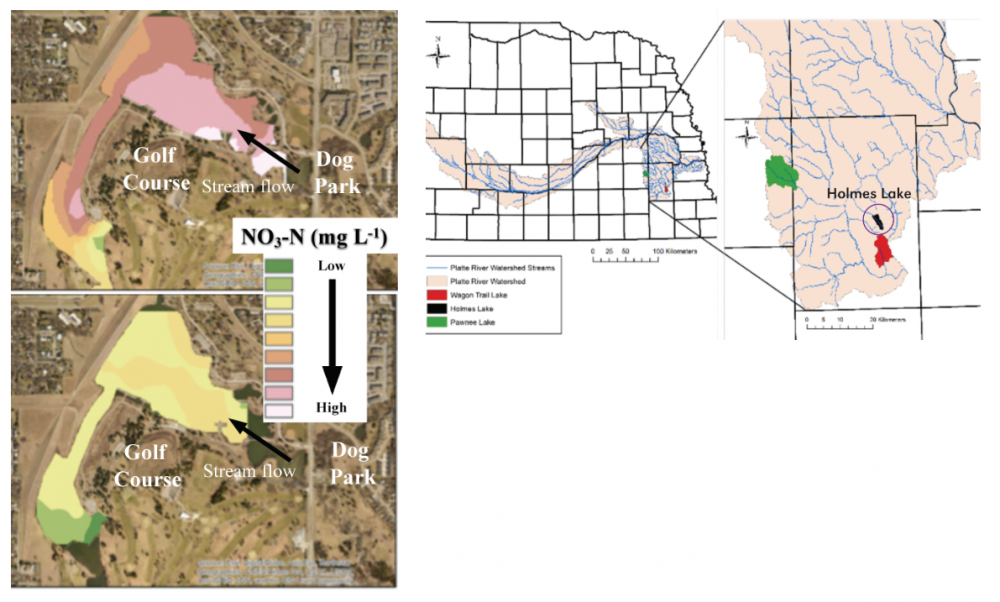
Nutrients including nitrogen (N) and phosphorus (P) are contaminants that degrade drinking, irrigation, and recreational waters across the Midwestern United States. These contaminants in high concentrations are dangerous to human health and can cause events like harmful algal blooms. The map below comes from research completed by the mesoLab at the University of Nebraska-Lincoln. Graduate student, Julia Lindgren, measured nitrate levels at Holmes Lake in Lincoln, Nebraska to monitor water quality and flow paths in the lake. Her data can be used to make data-informed recommendations for installation locations for a floating treatment wetland (FTW).
The maps below show nitrate levels before (bottom picture) and after (top picture) a large storm event.
How is Wildlife Migration expected to shift due to a Changing Climate?
September 2019
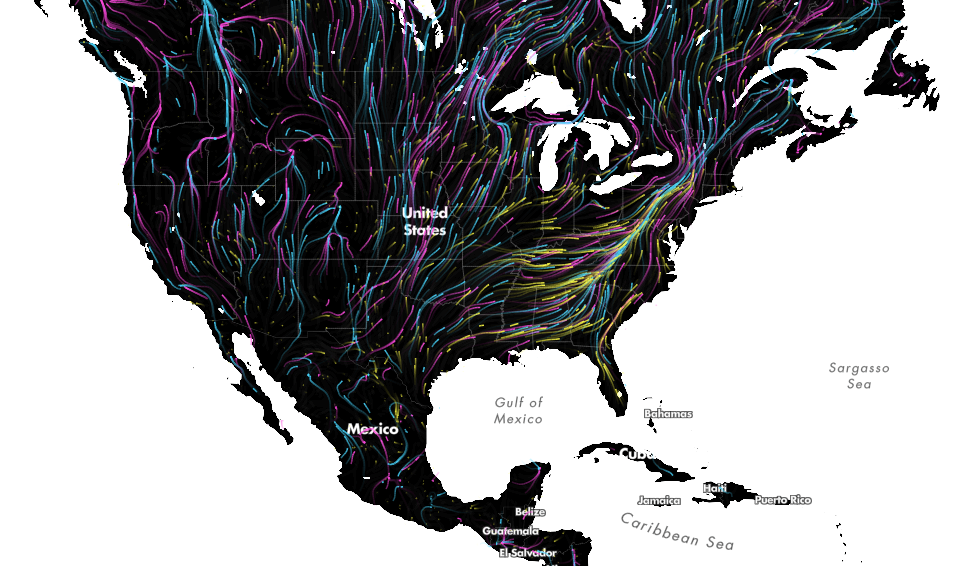
This map comes from work published by The Nature Conservancy. The map shows the average direction mammals (pink), birds (blue), and amphibians (yellow) need to move to find hospitable climates as they shift across the landscape. Researchers from the University of Washington and The Nature Conservancy modeled potential habitat for 2954 species using climate change projections and the climatic needs of each species. Using flow models from electronic circuit theory, they plotted movement routes for each species, connecting current habitats with their projected locations under climate change.
What Climate Changes are Expected in My Area Over the Next 100 Years?
April 2019
Are you curious about how the climate in your area might change over the next 100 years? How hot do you think summers will be? How will rain or snowfall compare to conditions now?
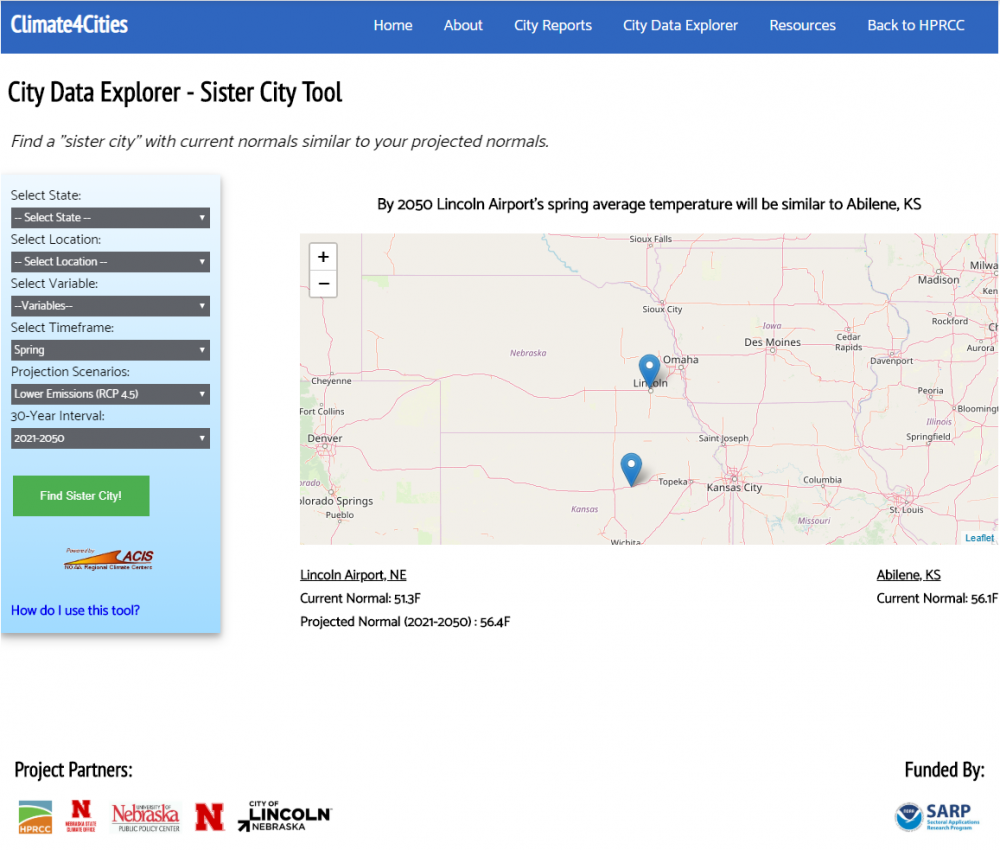
The Sister City Tool was developed so that you can explore climate projections in a unique way. Instead of simply providing climate projections in a numerical format, the Sister City Tool matches a location's projected future conditions with the current conditions of another location, otherwise known as a "Sister City". Give it a try! Select your state and location. Decide on which variable (average, min, or max temperature OR precipitation) and what time of year (spring, summer, fall, winter) you are most interested. Select a future scenario predicting higher or lower greenhouse gas emissions. Finally, choose how far in the future you want to explore. Click to find your "Sister City"-- you may need to zoom out on the map to see where it is located.
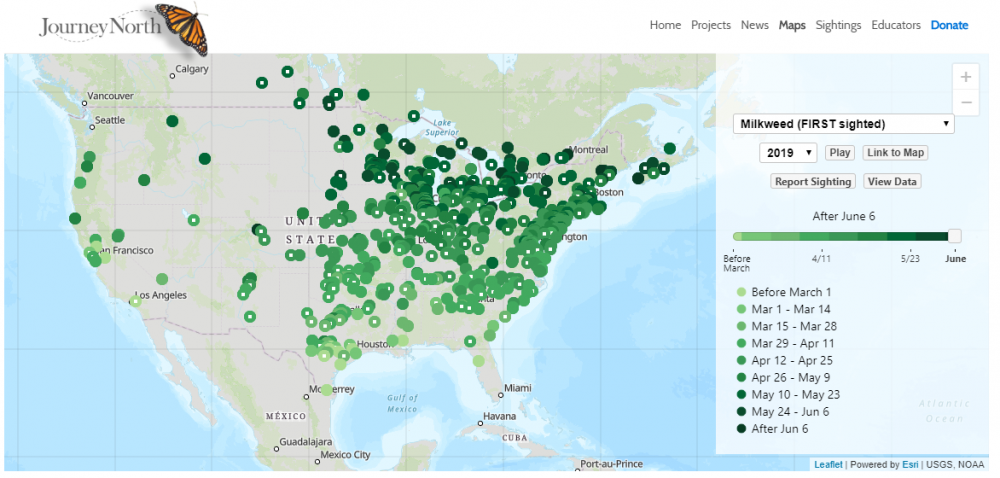
In North America, When Does Milkweed Start Growing in the Wild?
March 2019
This interactive map comes from The Journey North and shows when milkweed is first sighted in the wild by citizen scientists across the U.S. You can animate the map by dragging the slider along the timeline and pressing play.