Who is Most at Risk of Being Food Insecure in the U.S.?
April 2020
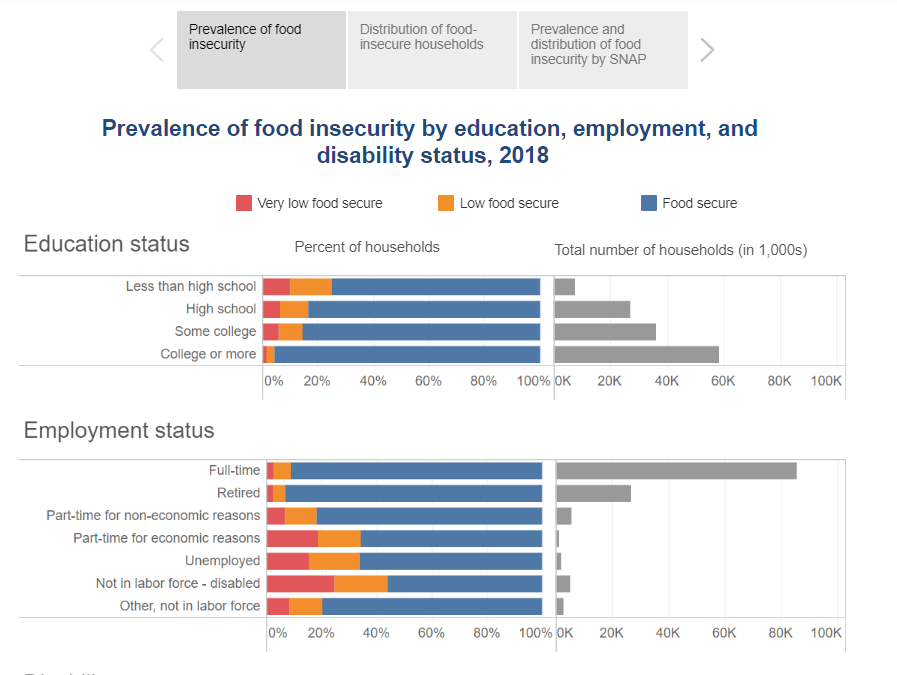
Food-insecure households are uncertain of having, or unable to acquire, at some time during the year, enough food to meet the needs of all their members because they had insufficient money or other resources for food: 11.1 percent (14.3 million) of U.S. households were food insecure at some time during 2018. Food-insecure households include those with low food security and very low food security.
- 6.8 percent (8.7 million) of U.S. households had low food security in 2018.
- 4.3 percent (5.6 million) of U.S. households had very low food security at some time during 2018.
Households with very low food security are food insecure to the extent that normal eating patterns of some household members were disrupted at times during the year, with self-reported food intake below levels considered adequate.
How Much Water is on My Dinner Plate?
March 2020
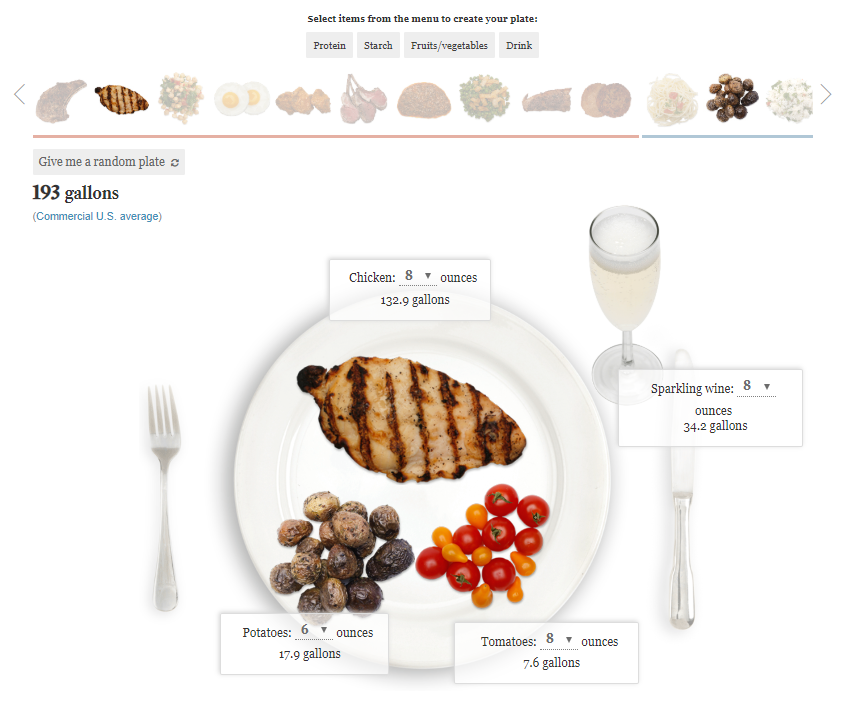
We know that plants and animals require water for survival, but the amount of water needed varies quite a bit depending on the plant or animal. The interactive menu below allows you to scroll through a variety of food choices to create your dinner plate and explore how eating different foods can impact your water footprint.
What's My Place in the World Population?
February 2020
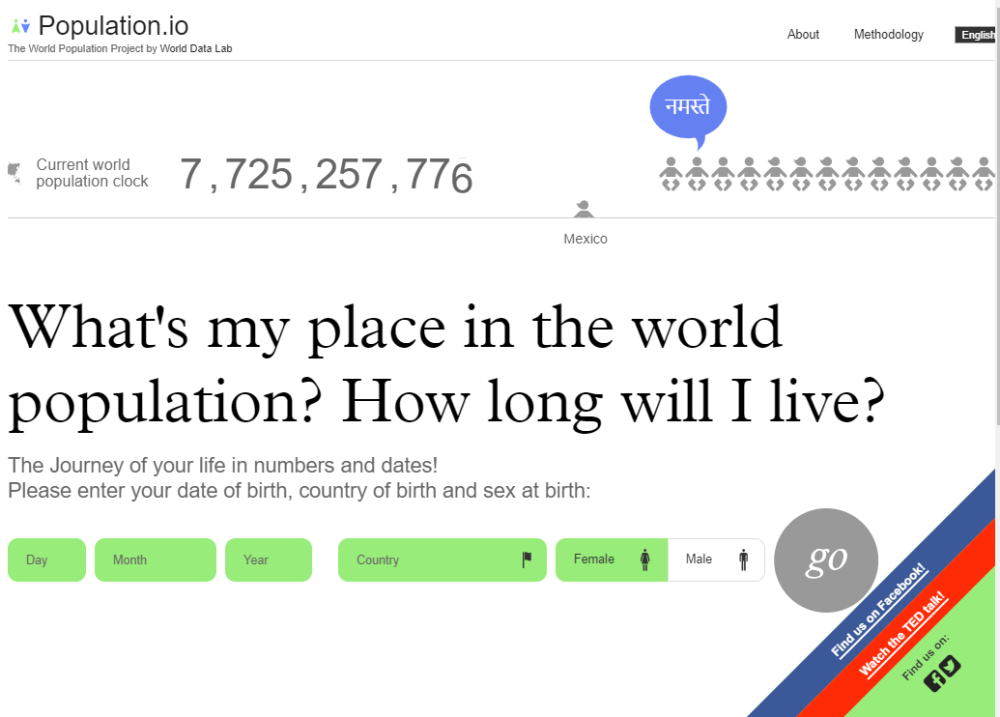
Population.io, brought to you by World Data Lab, aims to make demography – the study of human populations – accessible to a wider audience. They believe that demographic data can play an important role in understanding the social and economic developments of our time. Their hope is that people from all walks of life, in all ages and across all countries will explore a new perspective of their own life and find their own place in the world of today and tomorrow.
What interesting insights can you discover about your place in the world population after examining the data visualizations below? To get started, plug in your date of birth, country of birth, and sex at birth below.
How Have Earth's Carbon Pools Changed Over Time?
January 2020
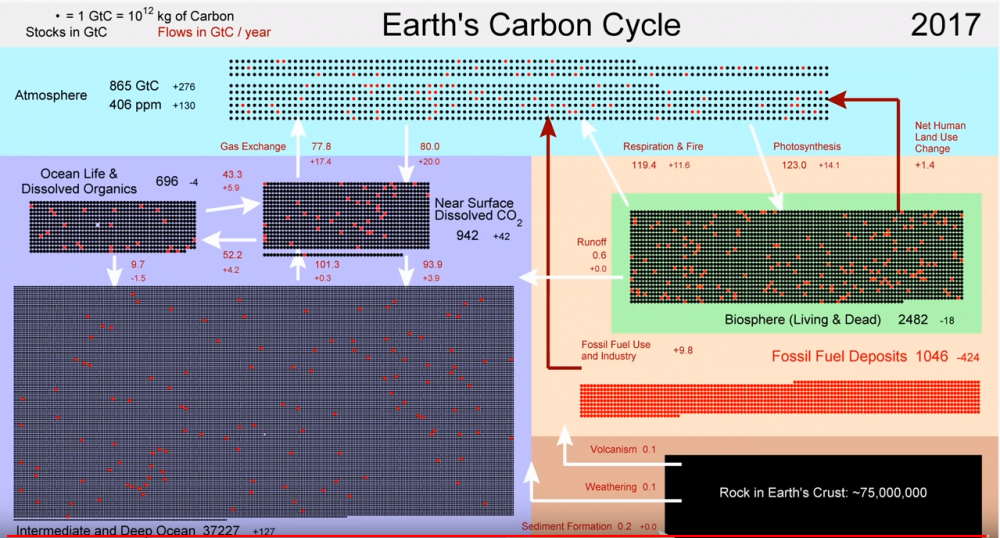
The animation below comes from Robert Rohde, lead scientist with Berkeley Earth. It shows changes in Earth's carbon cycle over time.
Carbon, in various forms including carbon dioxide and organic materials, is continually exchanged between the atmosphere, oceans, and biosphere. In the pre-industrial period, these exchanges found a natural equilibrium such that the amount of carbon in each group remained more or less constant. However, human activities have perturbed the carbon cycle.
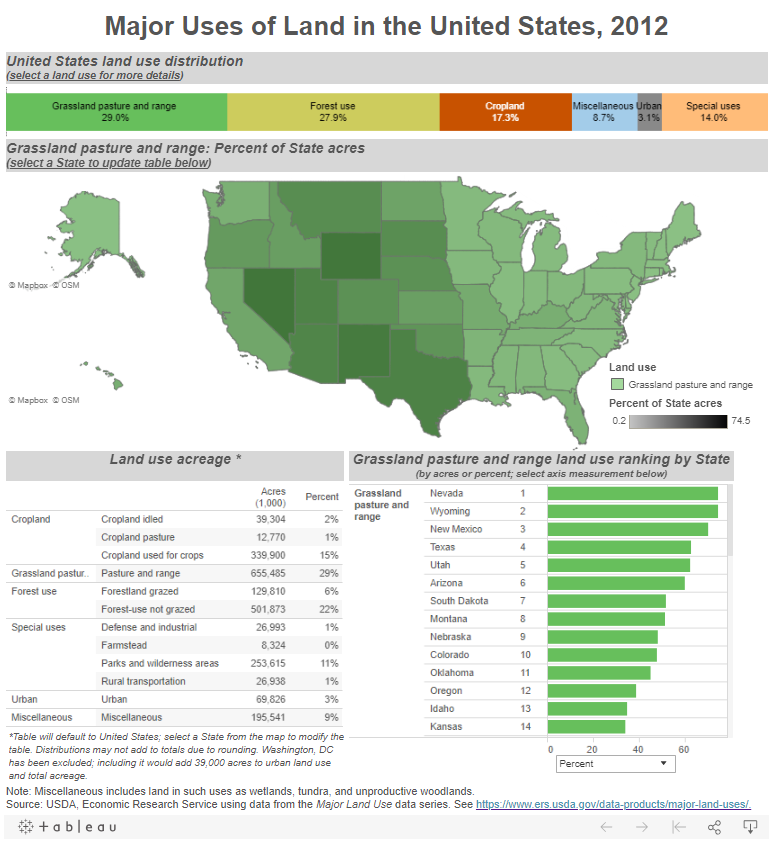
How do we use Limited Land Resources in the U.S.?
November 2019